Selecting the right contract manufacturing (CM) partner to bring a product idea to market can be a daunting task. The traditional data-driven approach focuses on strategic and financial markers such as location, capability, market fit, and cost. While aspects such as social impact and environmental footprint may be reviewed, they do not typically factor quantitatively in the decision process.
When comparing quotes from multiple manufacturers, Synapse considers aspects like BOM cost, transformation cost, and supply chain reach. Recently, we have begun to ask deeper environmental questions such as how much water the factory consumes or how its electricity is generated. Since every brand wants to offer the highest quality products for the lowest possible cost, what role should environmental impact play in the CM selection process and what data is available to support it?
The good news is that for many of the top manufacturers in the world, this environmental and social data has been publicly available for several years. The data reporting is a direct result of the UN’s 17 Sustainable Development Goals (SDGs) that were widely adopted in 2015. Target 12.6 encouraged “large and transnational companies to adopt sustainable practices and to integrate sustainability information into their reporting cycle.” According to the UN, “analysis from a sample of over 10,000 public companies around the world shows that over 60 percent of large companies published sustainability reports in 2021, a twofold increase from 2016.” In our review of 113 global electronics contract manufacturers we identified 43 companies that report and share this data annually. With this wealth of sustainability information readily available, how should we modify our CM selection process to make meaningful comparisons on carbon emissions?
Before we throw out our existing CM scorecard templates and start over with a blank spreadsheet, let’s review the obstacles to overcome with this new environmental treasure trove of data:
Issue 1: The Data Is Vast
Corporate environmental data is published in detailed annual reports and contains a myriad of important statistics including land usage, pay equity and gender diversity, water and electricity consumption, and greenhouse gas (GHG) emissions data. Distilling these data-rich annual reports down to key indicators of environmental efficiency can be an intimidating undertaking.
Issue 2: The Data Is Not Easy to Compare
The global nature of this industry and lack of regulated standards between different countries causes variation in reported categories, metrics, and units of measure. Many companies use Global Reporting Initiative (GRI) reporting structures, but even within this framework there are disparities in units and which data sets are reported.
Issue 3: There Is No Objective Measure of What Is “Good” or “Bad”
Obviously the goal is to be carbon neutral but since that is not yet possible for most, what is an appropriate level of emissions for a company of a given size? And how do we compare organizations with vastly different global footprints and manufacturing outputs? There is simply no easy way to tell if a company is performing better or worse than average or if they are on track to meet their goals.

It’s important to note that many companies have only started publicly disclosing this information in recent years and may have only just begun their journey to a more sustainable mode of operation. In addition, during the tightening supply chain and staffing struggles of the pandemic years, many companies understandably shifted their focus from sustainability to survival. In some respects, focusing on core business functions is good for emissions, as travel and unnecessary expenditures are curtailed, but the net effect is a pullback in investment and momentum needed to achieve industry progress on carbon emissions reduction. And with 2030 deadlines fast approaching, the window for companies to significantly impact milestone sustainability targets in manufacturing is closing.

A good first step is to include sustainability metrics in the formal quotation and selection process to better reflect a vision of product development that is less harmful to people and the planet.
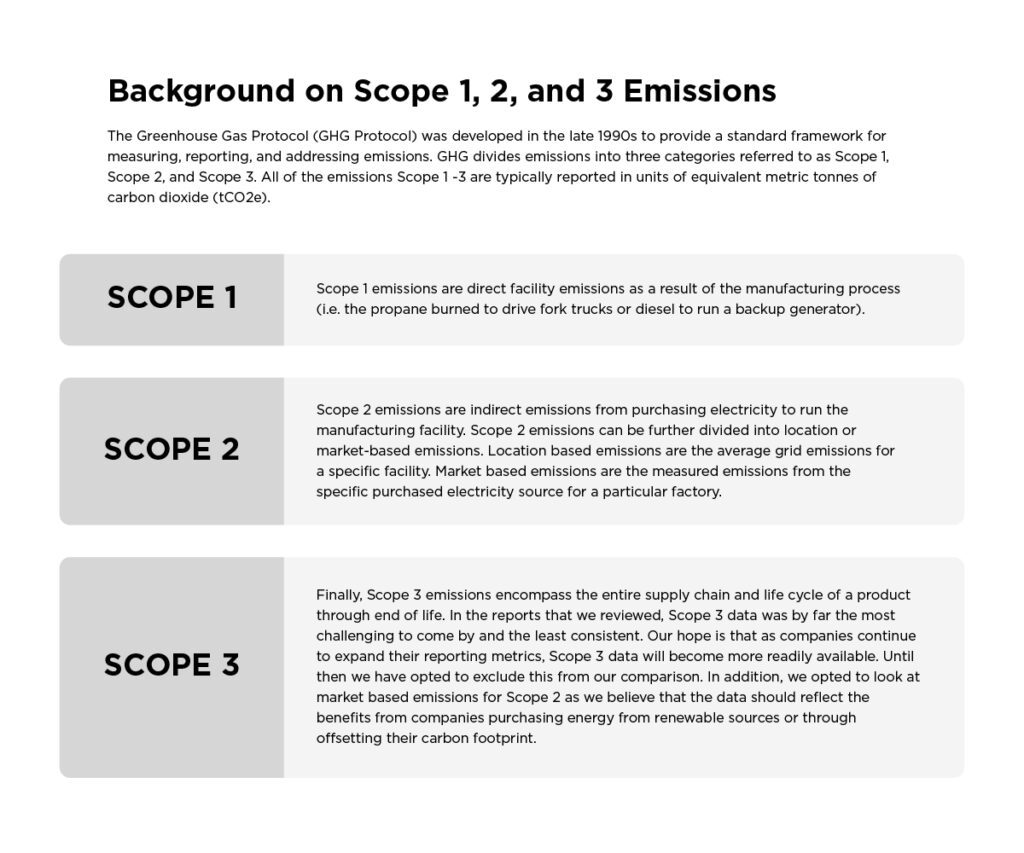
For the purposes of our study, we chose to look exclusively at greenhouse gas emissions that contribute directly to climate change, expressed as tonnes of carbon dioxide equivalents (tCO2e). Of all of the data included in corporate sustainability reports, the carbon emissions data is by far the most accessible and complete. We view this as a starting point and want to include more factors as we expand and grow our database.
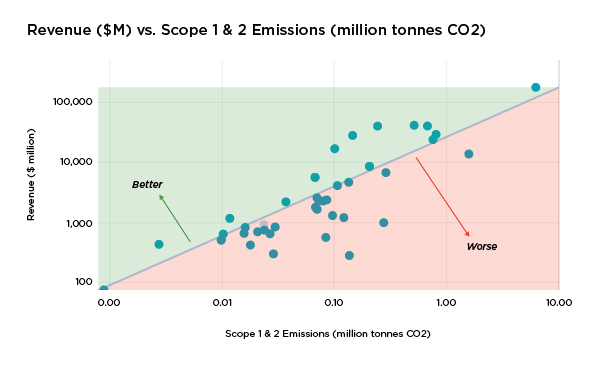
One of the main issues when comparing absolute carbon emissions between companies of different sizes is that carbon output is largely a function of operational footprint. We considered various ways of normalizing the data, whether by number of employees, total square footage of manufacturing space, or annual revenue. We landed on annual revenue as a metric that captures the scale of operations and is readily available. The major assumption guiding this metric is that companies that produce more economic value are expected to emit more absolute amounts of carbon. This metric does not account for inflation which could reduce normalized emissions numbers in years where inflation is significant and distort year-over-year comparisons. But this factor wouldn’t affect our primary use case of comparing similar manufacturers within a given operational year.
To demonstrate how this metric would work for comparisons, we plotted the 2021 revenue reported by 43 major contract manufacturers in the electronics industry as a function of their total Scope 1 and 2 emissions (see Figure 1). The plot is shown on a log-log scale with power regression for clarity; however, the data generally follows a linear trend with a slope of 29.9 tonnes of CO2 equivalents per million dollars of revenue (tCO2e/$M). Using this average emissions rate, it is now possible to assess whether companies are outperforming the industry (i.e. emitting less carbon dioxide per million dollars of revenue) and which ones are underperforming. As these companies continue to implement emission reduction plans and electrical grids transition to renewable sources, the industry average should continue to trend downwards each year.

Another way we reviewed this data was by looking at the average reduction in normalized emissions from 2017 to 2021 (data for 2022 was not available yet as of this writing). This data set includes the anomalous pandemic year of 2020 and the related work stoppages and revenue losses. In addition, this data is not perfectly linear and companies will naturally perform better economically in some years and regress in others due to factors such as product mix, factory capacity, and tightness of labor markets. However, the reduction of average emissions is an important metric to discern which companies are making active progress year over year.
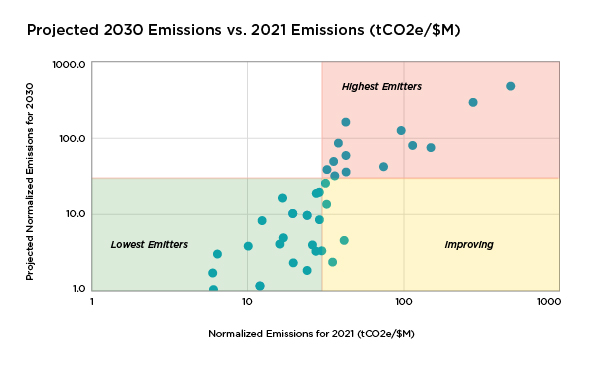
The results clearly delineate companies into three main groups. The first are heavy emitters that do not yet show a clear path towards future reduction. Based on their annual environmental reports, these companies are primarily reliant upon coal as their source of electricity. While they may be working to reduce their reliance on coal generated electricity and cut their total energy usage, these reductions only amount to an average of <2% in total emissions. Companies in this group are represented in the top right quadrant of Figure 2.
The second group of companies are heavy emitters that show year over year improvement and exhibit a clear trend towards continued future emissions reduction. These companies are represented in the bottom right quadrant of Figure 2.

of 29.9 tCO2e/$M. Partnering with companies in the Lowest Emitters quadrant could reduce the carbon footprint of your product.
Finally, the third group represents companies that are “below average emitters on a path towards further reduction by 2030.” These companies are located in the bottom left quadrant of Figure 2. The hope is of course that all companies will eventually fall into this third category through outside pressure from clients seeking this data and pushing for more sustainable manufacturing. These manufacturers have implemented significant programs to increase their renewable energy from solar and hydroelectric sources, and have demonstrated 20%-30% reductions in normalized emissions year over year for the past 3-5 years. For example, one firm purchased enough solar and hydropower to reduce their emissions by more than 50% while another company reported that 9% of their global power is sourced from renewable energy.
The companies that are reducing their emissions most significantly are doing so through deliberate planning and execution. They have set up governing bodies that report into executive leadership to hold them accountable. Their footprints are not reduced by chance, but by measuring their emissions and implementing carbon reduction projects. If we can screen companies for their sustainability results during the bidding and quoting process, then we can reward these companies for their environmental stewardship and guide the entire industry towards a lower carbon future.
A 2021 article in the Harvard Business Review argues that the impact of reporting sustainability metrics is being oversold because even with widespread annual reporting, emissions are continuing to rise. There is an element of truth to this, as a lot of metrics that are being reported haven’t been fully valued and utilized by the global market when it comes to purchasing decisions. Ultimately it’s up to all of us to source responsible manufacturing partners based on the available data and to start weighing the impact of those decisions on people and planet on equal footing with cost and quality.


